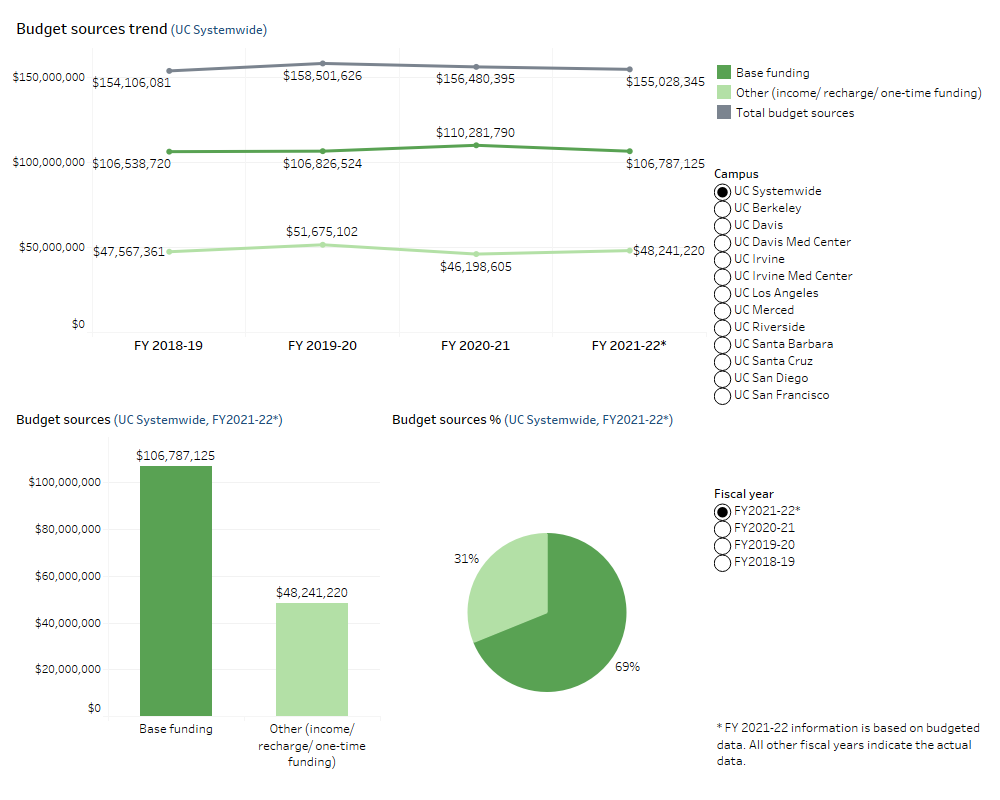
Each UC police department's budget and workforce reflect its organizational model, along with ongoing transformation as needs for services change and officer assignments shift.
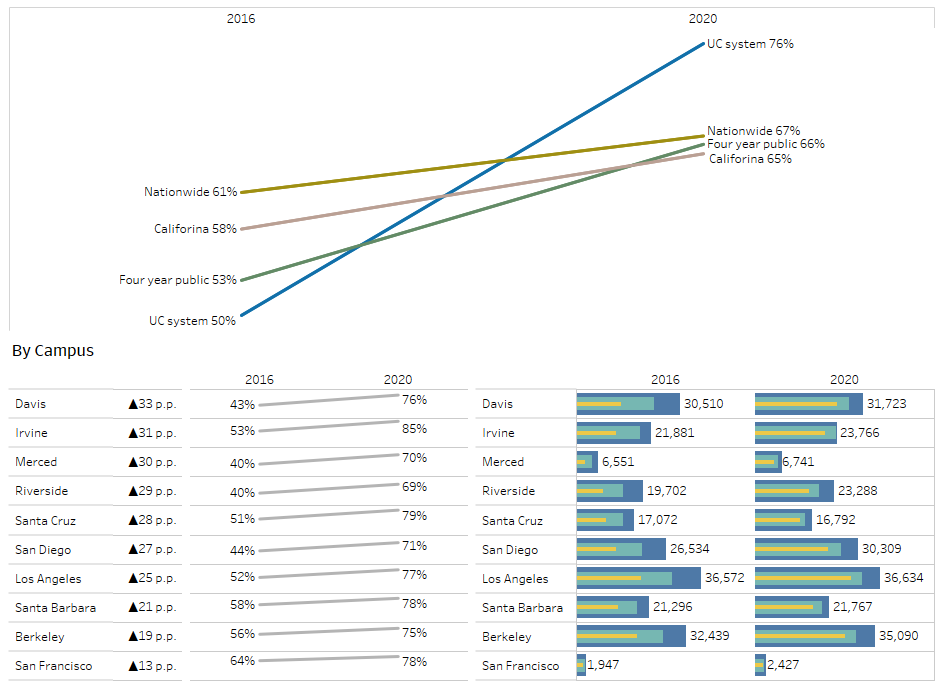
All UC campuses and the Office of the President have published disaggregated graduation rates dashboards with most campuses displaying detailed information by student demographics and by academic programs.
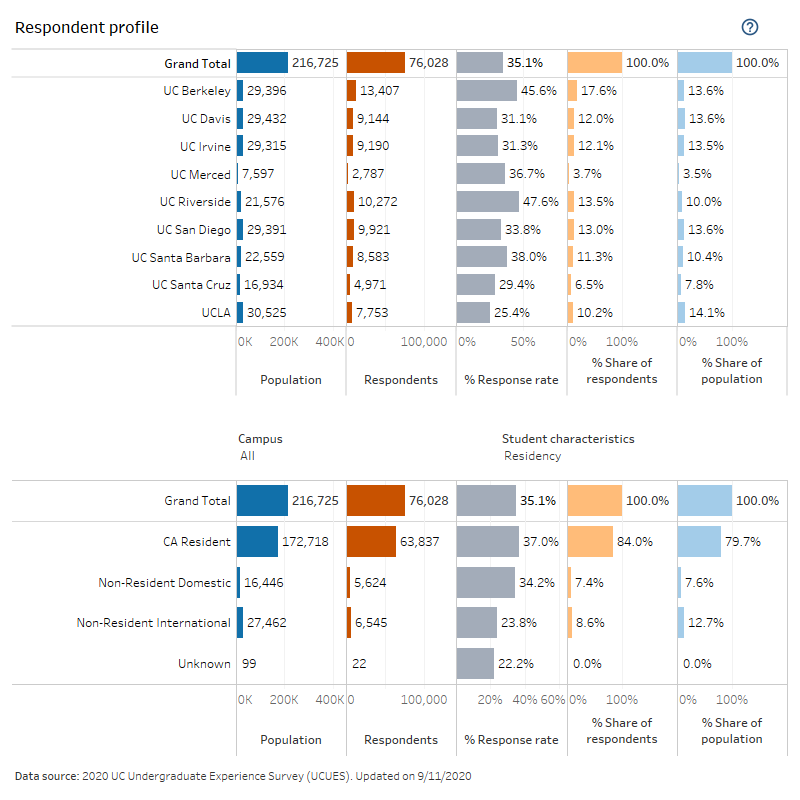
In 2020, the UCUES survey added questions related to the possible effects of COVID-19 on student learning, health, and Fall 2020 enrollment plans, as well as student remote learning experiences and remote instruction concerns.
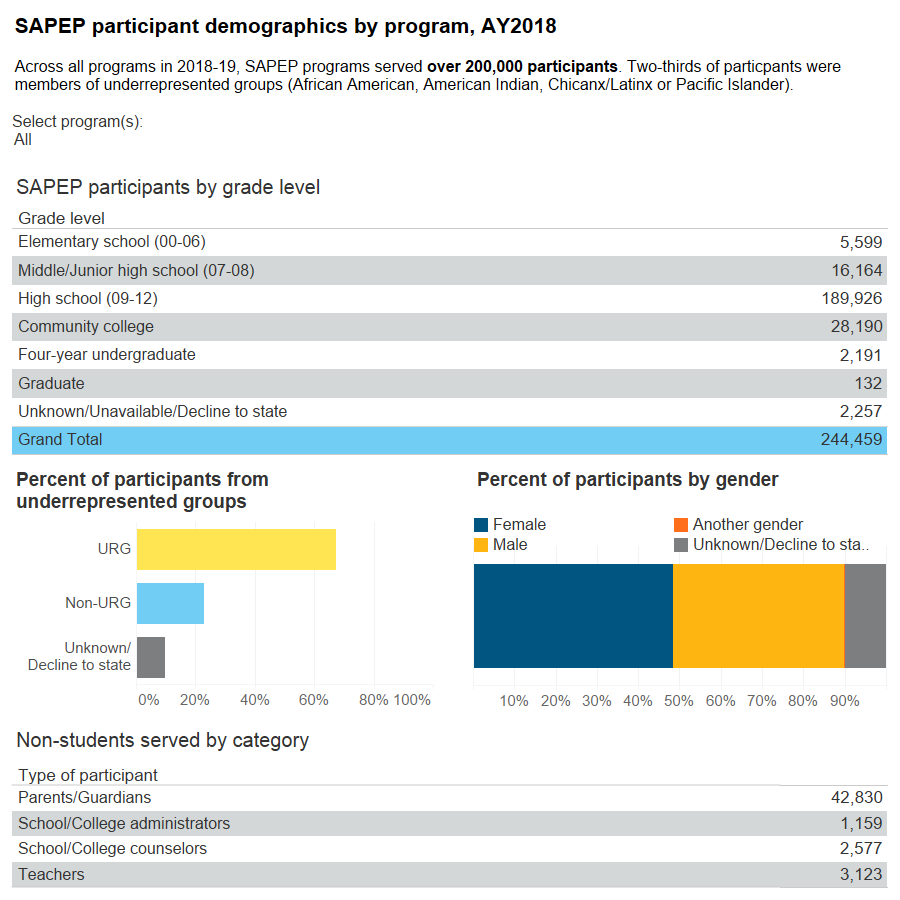
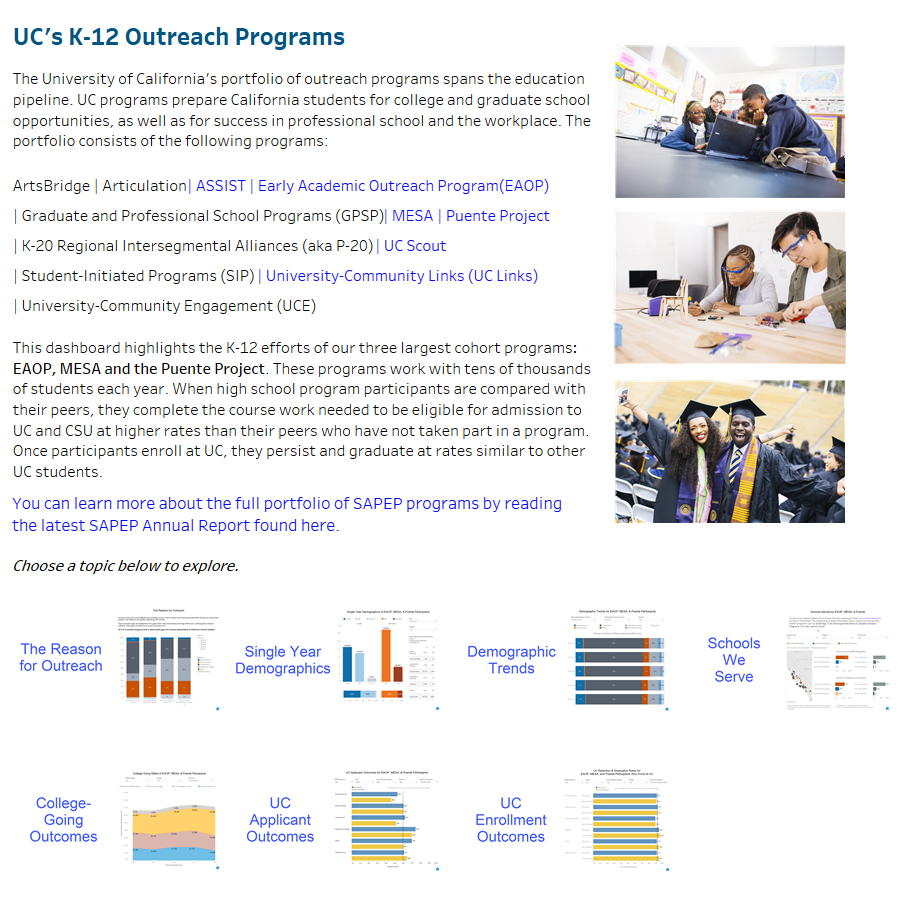
The SAPEP portfolio comprises 13 educational programs administered by UC. Their purpose is to raise achievement levels and close achievement gaps among targeted student groups across California public schools, from pre-K to postgraduate.
UC’s K-12 outreach programs prepare California students for college and graduate school opportunities, as well as for success in professional school and the workplace.
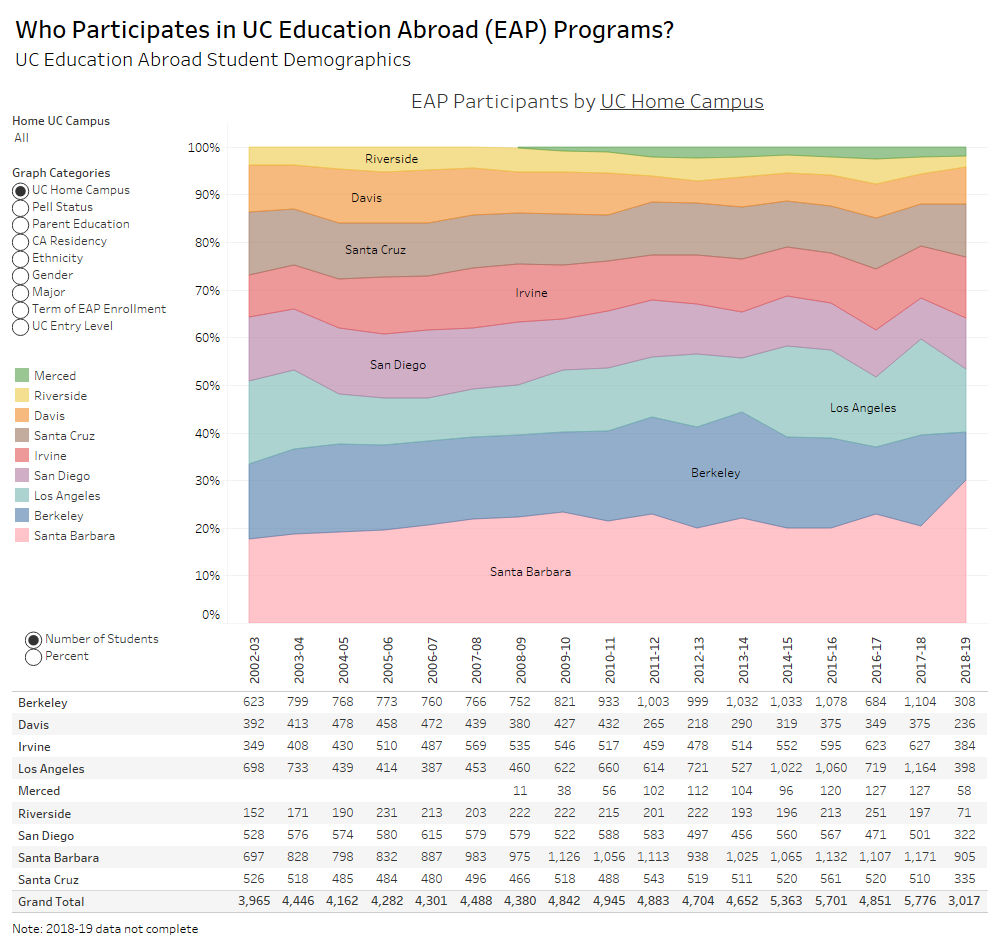
Participation of UC students in the education abroad program by campus and other demographic characteristics; earnings of education abroad participants compared to non-participants.
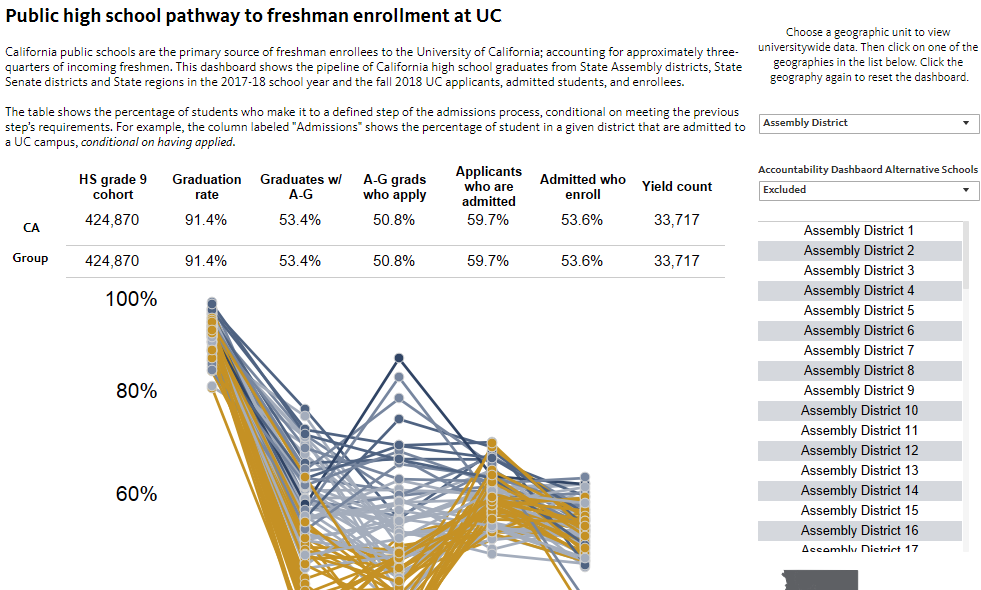
This dashboard shows the pipeline of California high school graduates from State Assembly and State Senate districts and California regions in the 2017-18 school year and the fall 2018 UC applicants, admitted students, and enrollees.
This dashboard explores the voting behavior of UC students in the 2020 federal elections compared to that in 2016, using data from the National Study of Learning, Voting, and Engagement.