Woman on a computer working in front of a large glass window.

Information center

Explore the UC story through data

Subject

UC campus and program climate

This dashboard presents responses to undergraduate and graduate student experience survey questions about campus and program climate.

California Climate Action Initiative funded projects

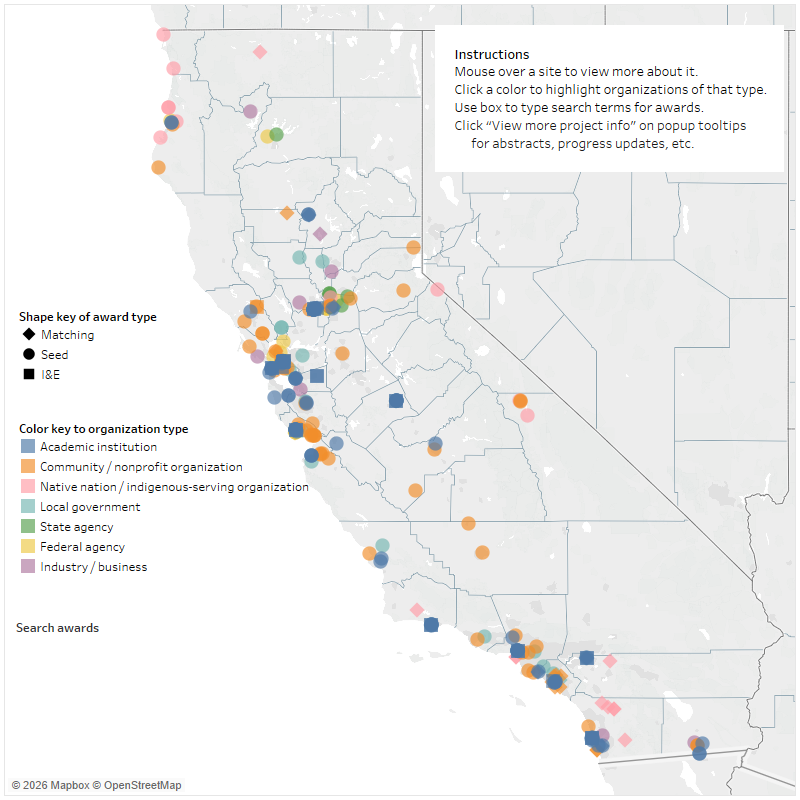
Discover the statewide impact of the California Climate Action Initiative by exploring this map of sites for the California Climate Action Seed and Matching Grants and the UC Climate Action Innovation & Entrepreneurship Awards.

UC employee headcount

Employee headcount dashboard with October and April snapshots back to 2011.

UC workforce diversity

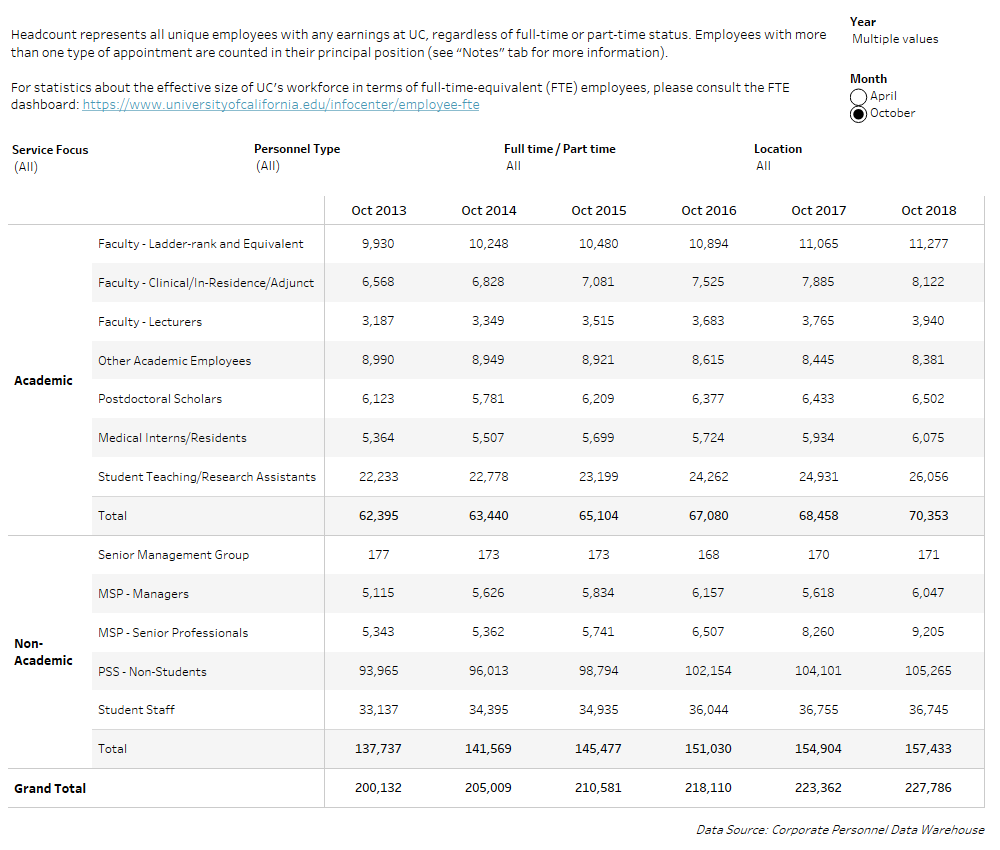
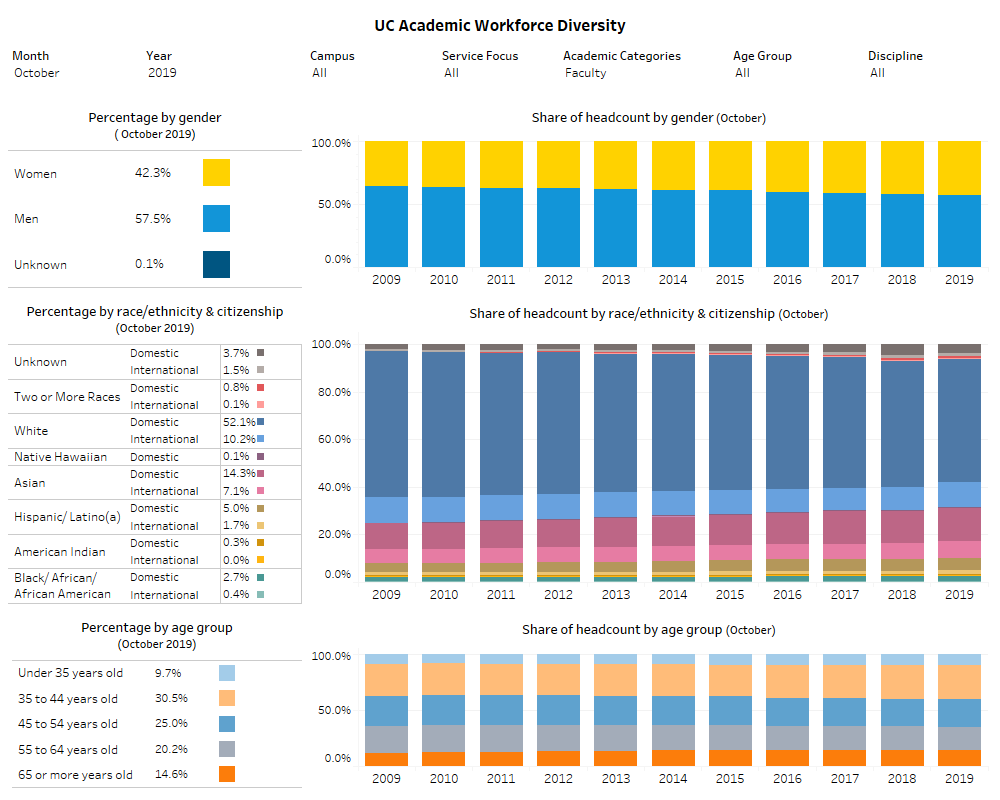
Current state and historical patterns in the gender, ethnic, and age diversity of UC employee segments using various interactive filters. (Back to 2011.)

UC employees, full-time equivalent (FTE)

FTE of personnel by category and fund source with October and April snapshots back to 2011, as well as fiscal year data.

UC 2030 dashboard

This dashboard shows the UC 2030 goals in UC's multiyear framework.

Course enrollment by instructional modality

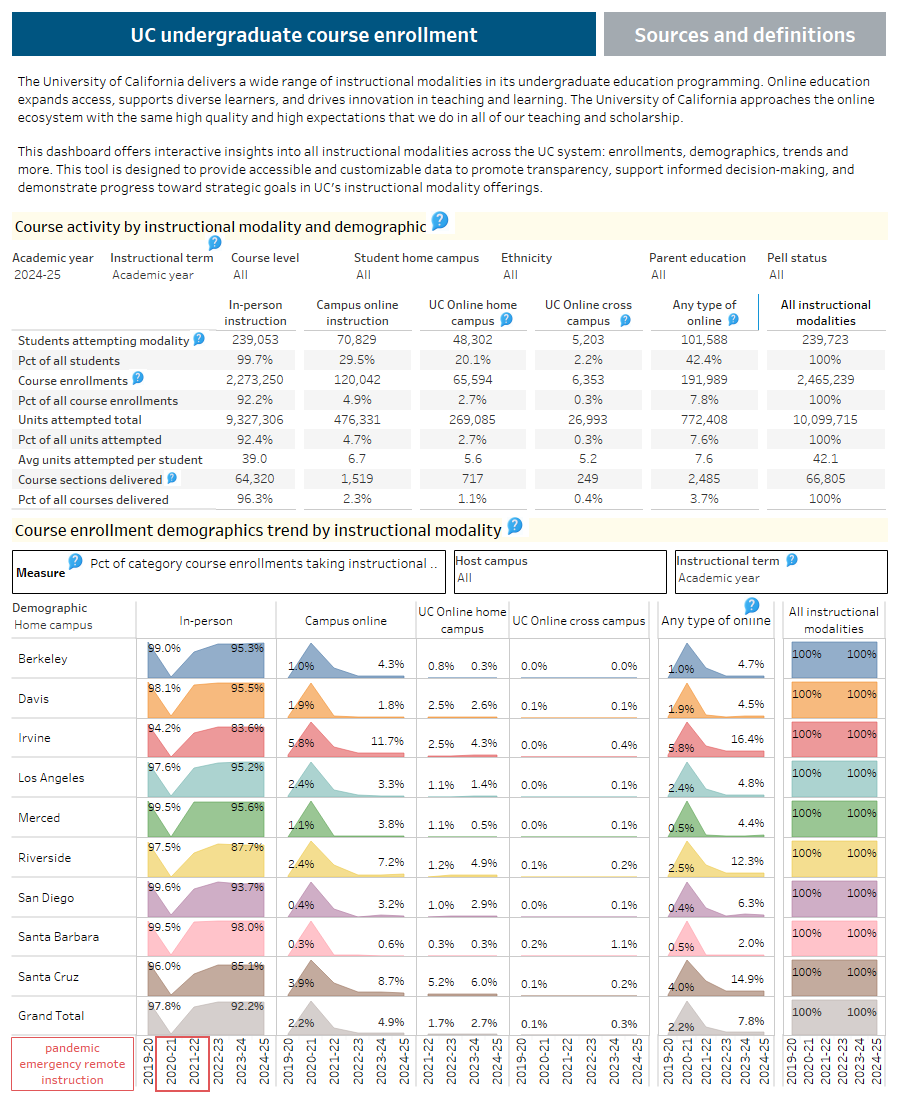
This dashboard provides insights into the different undergraduate instructional modalities across the UC system, including the number of students taking online vs in-person courses, the share of UC’s instructional offerings that are offered online vs. in-person, and the demographics of students by each instructional modality.

UC inventions at a glance

UC technology commercialization benefits the public by transforming UC inventions into innovative products and economic impacts.

Undergraduate affordability

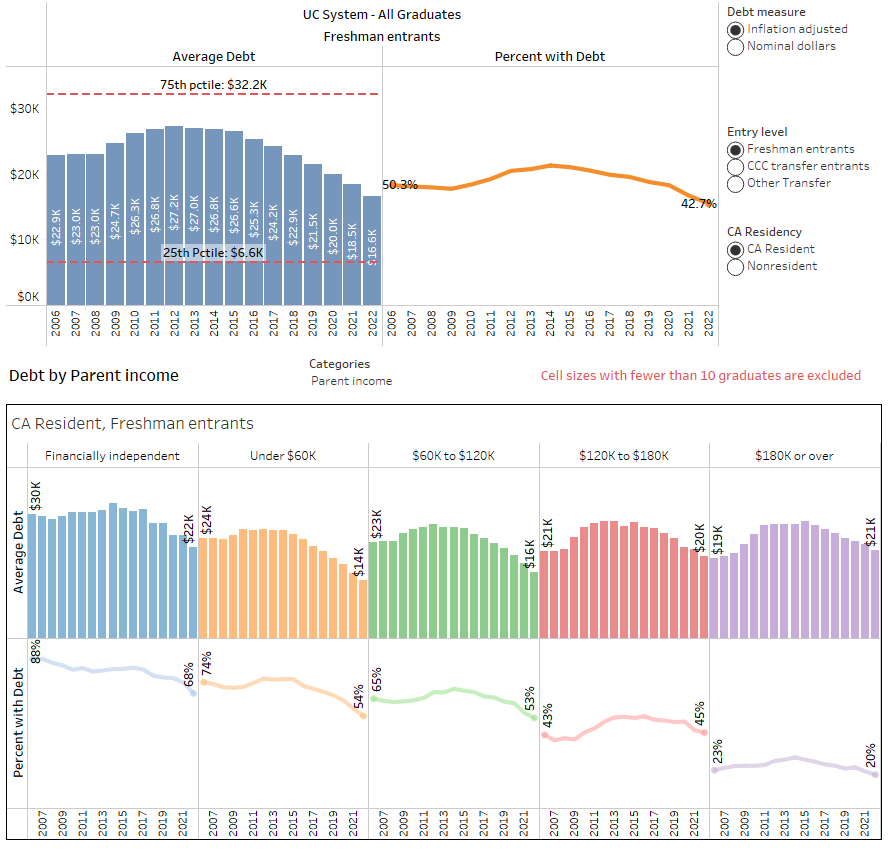
Gain knowledge of UC Undergraduate financial support, net cost of attendance, student loan debt, and cumulative debt burden at graduation for UC students.

UC community safety dashboards

The UC Community Safety Plan calls on all UC campuses to collect and publicly share uniform campus safety data to empower the UC community and inform change.