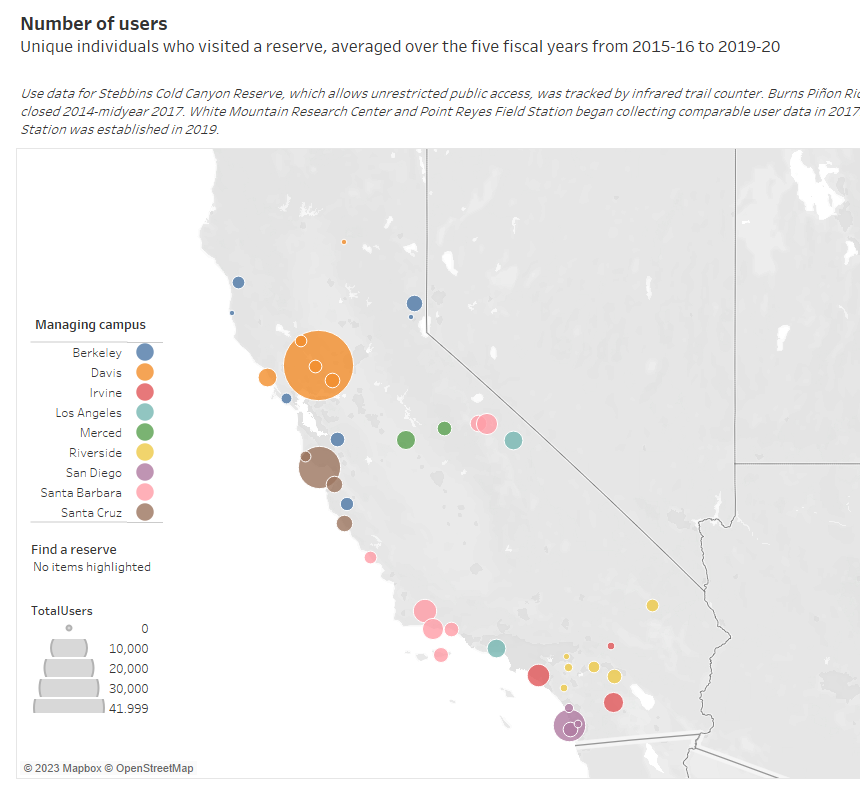
UC Nature's reserves are a library of California ecosystems used for research, teaching, and public outreach. Learn how our protected lands serve as outdoor laboratories and classrooms without walls, advancing our understanding of the natural world.
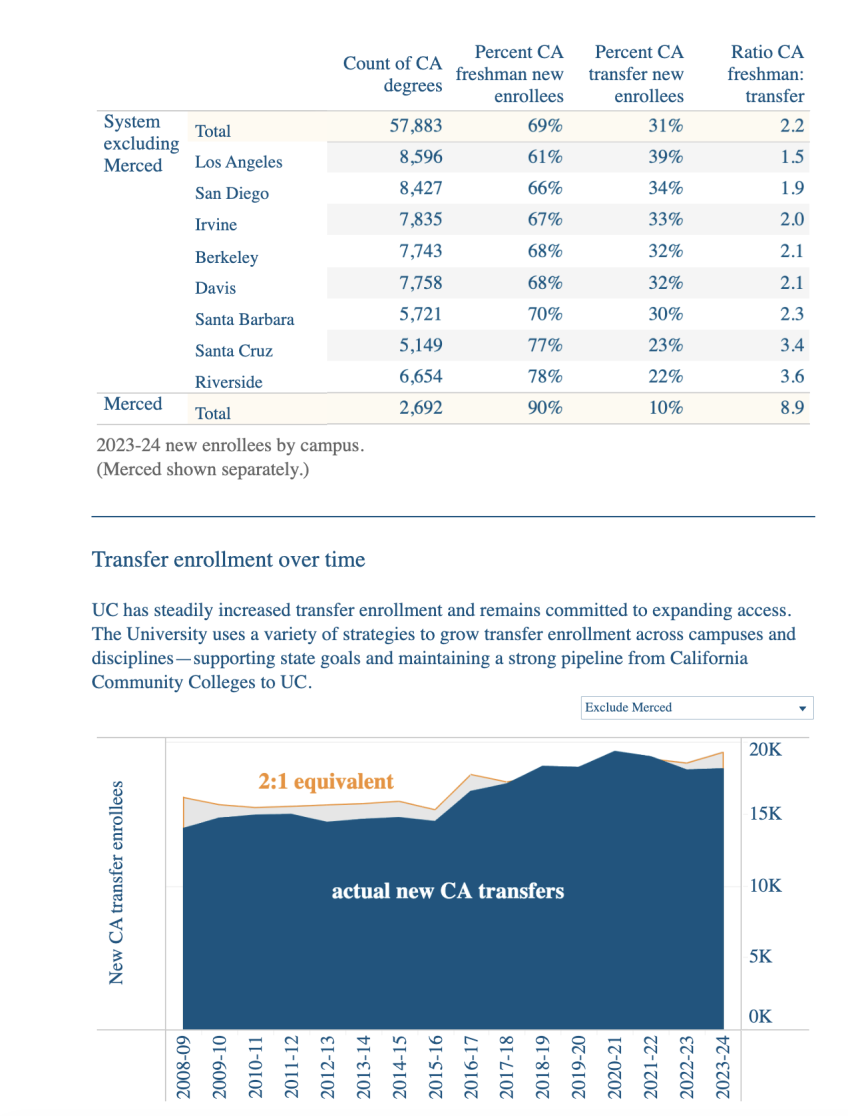
The California Master Plan calls for the University of California (UC) to accommodate all eligible resident California Community College (CCC) transfer students.
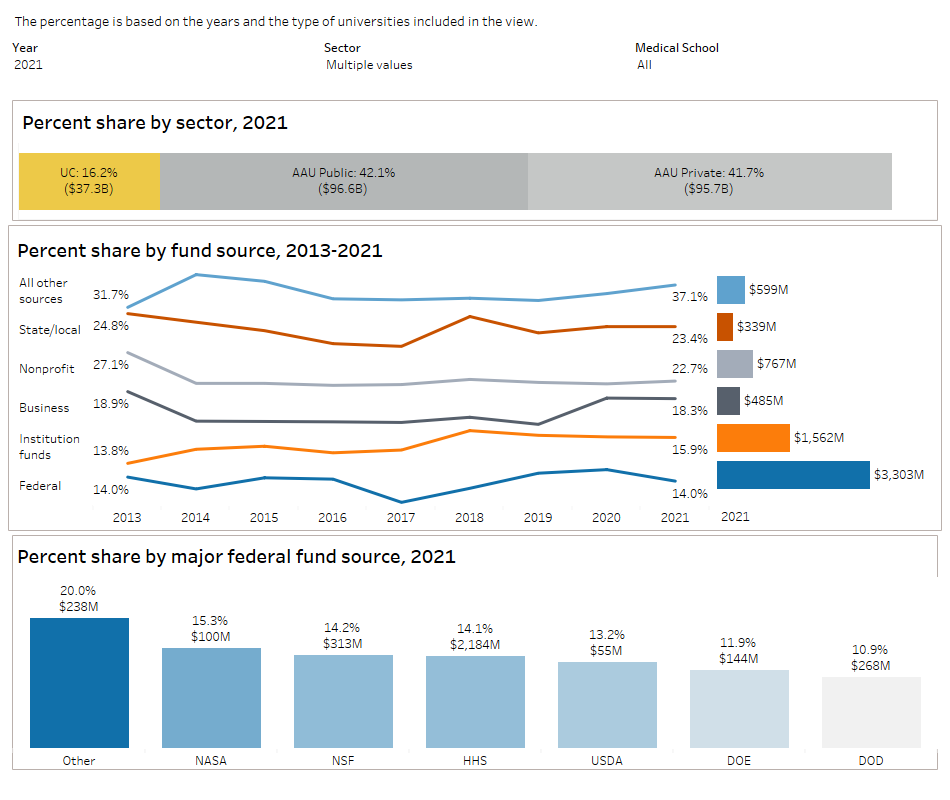
Research expenditures of higher education institutions participating in the Higher Education Research and Development (HERD) survey are compared across institutions, by fund source, NSF disciplines, and subjects. UC’s percent share of expenditures is also shown by sector, fund source, and major federal fund sources.
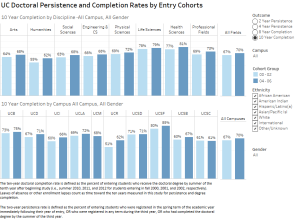
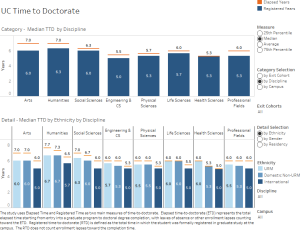
This dashboard presents time-to-doctorate outcomes for University of California doctoral graduates. Results are available by doctoral exit cohort year, broad discipline, student demographic characteristics, and time-to-degree measure. Additional definitions and methodological notes are available within the dashboard.
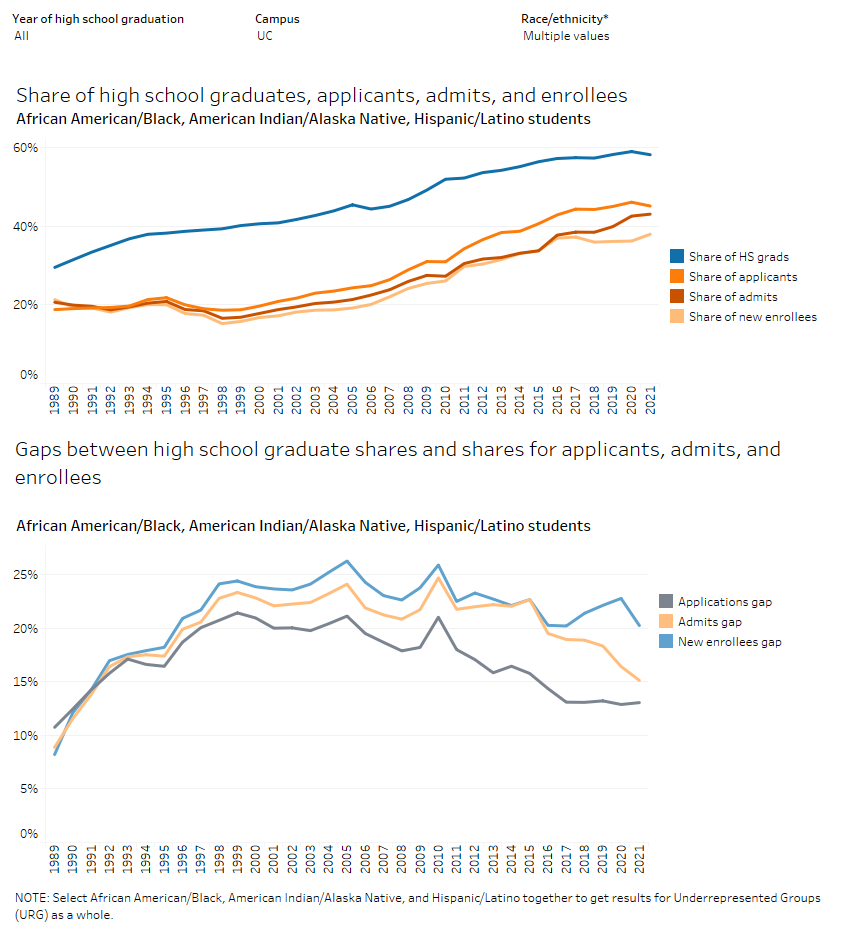
Analysis of the gaps between the share of: high school graduates vs. freshman UC applicants, admits, and new enrollees and
California Community College (CCC) students vs. CCC-to-UC transfer applicants, admits, and new enrollees
by racial/ethnic group.
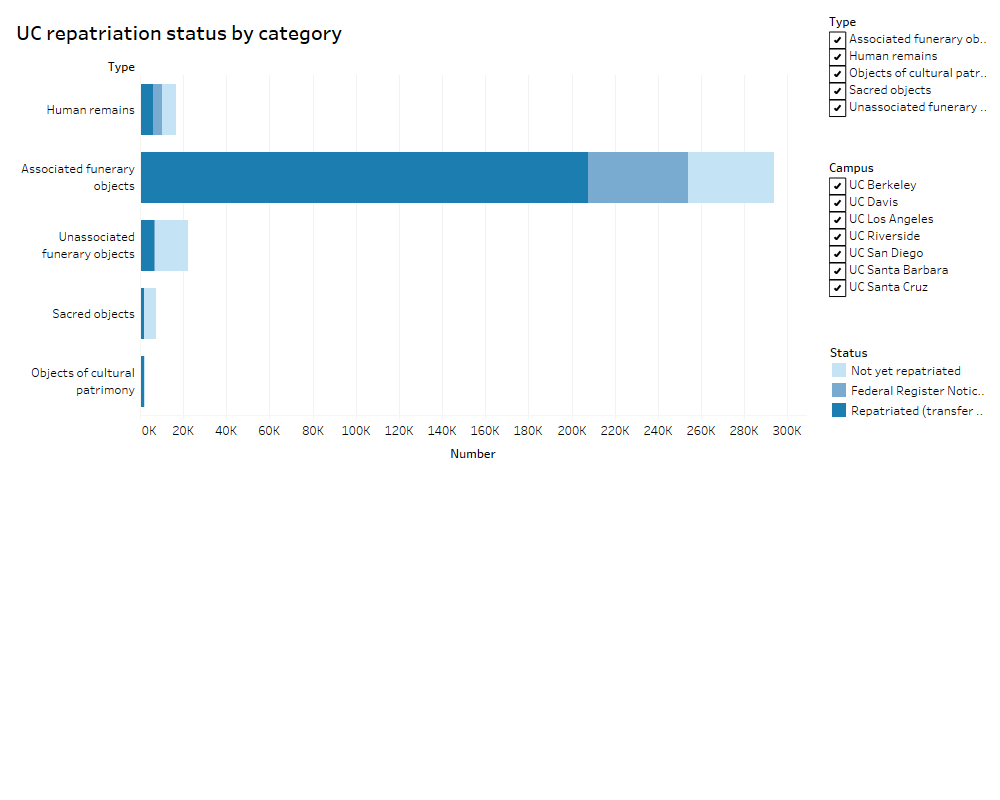
Information on the repatriation of Native American human remains and cultural items under the Native American Graves Protection and Repatriation Act (NAGPRA) and CalNAGPRA.