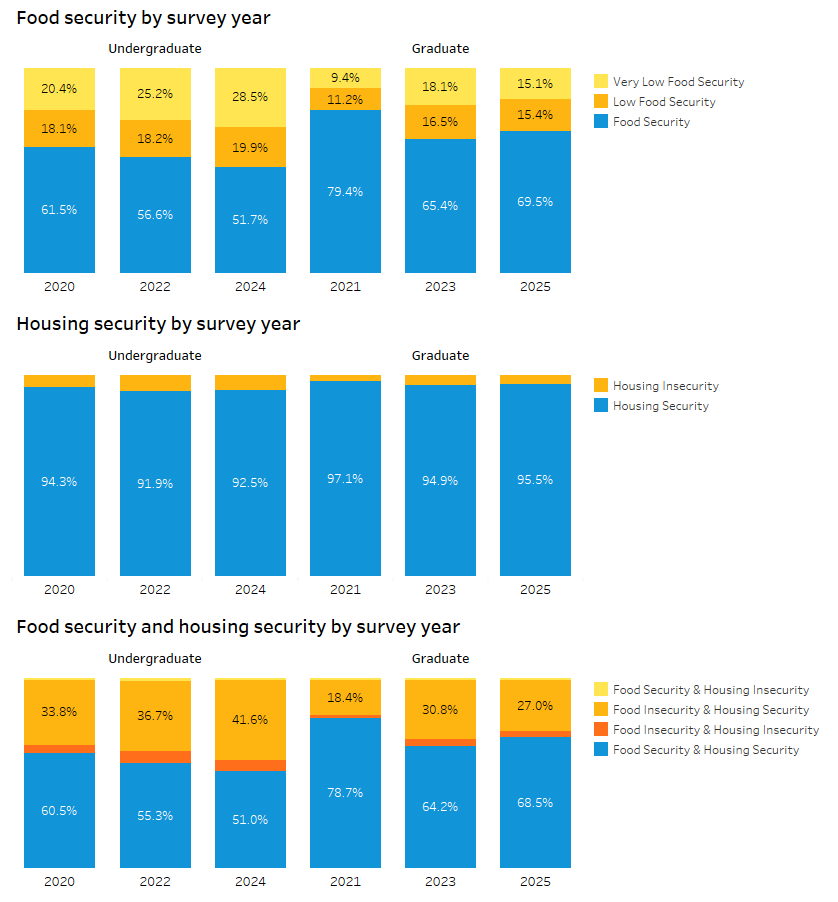
Student basic needs survey data is summarized in this dashboard along with relationships to important wellbeing and student success measures as they relate to students' experiences with basic needs (un)fulfillment.
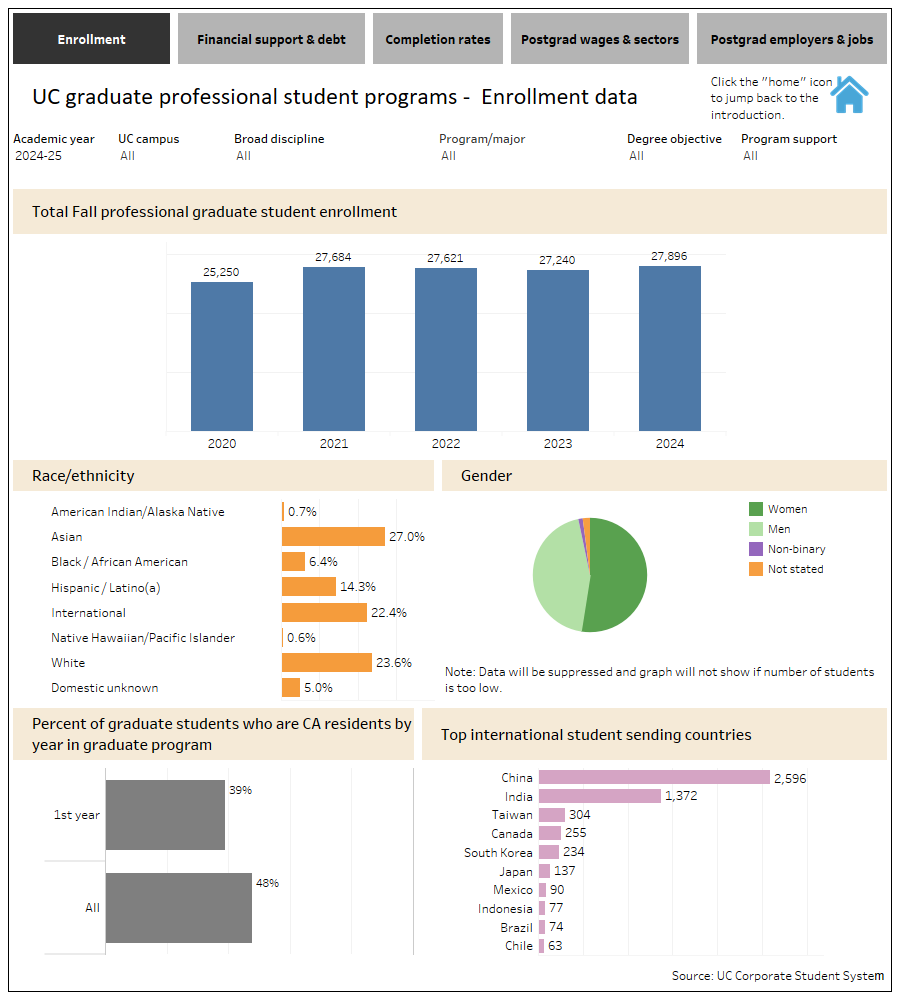
Graduate professional programs prepare students for careers in fields such as medicine, law, business, and education. These programs offer advanced professional degrees — including master’s and professional practice degrees like MDs and JDs — that equip students with the knowledge and skills needed for leadership in their professions. This dashboard provides systemwide data on UC graduate professional students, including enrollment, demographics, financial support and debt at graduation, completion rates, and post-graduation employment and wage outcomes.
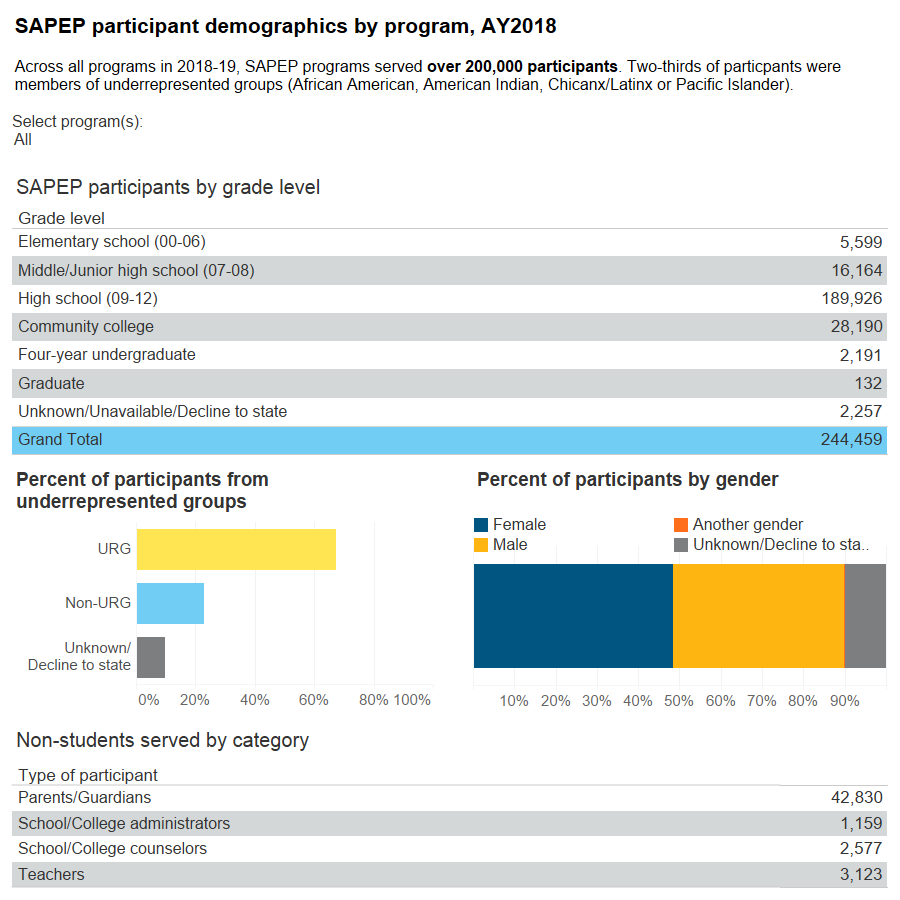
The Student Academic Preparation and Educational Partnerships (SAPEP) portfolio comprises 13 educational programs administered by UC. Their purpose is to raise achievement levels and close achievement gaps among targeted student groups across California public schools, from pre-K to postgraduate.