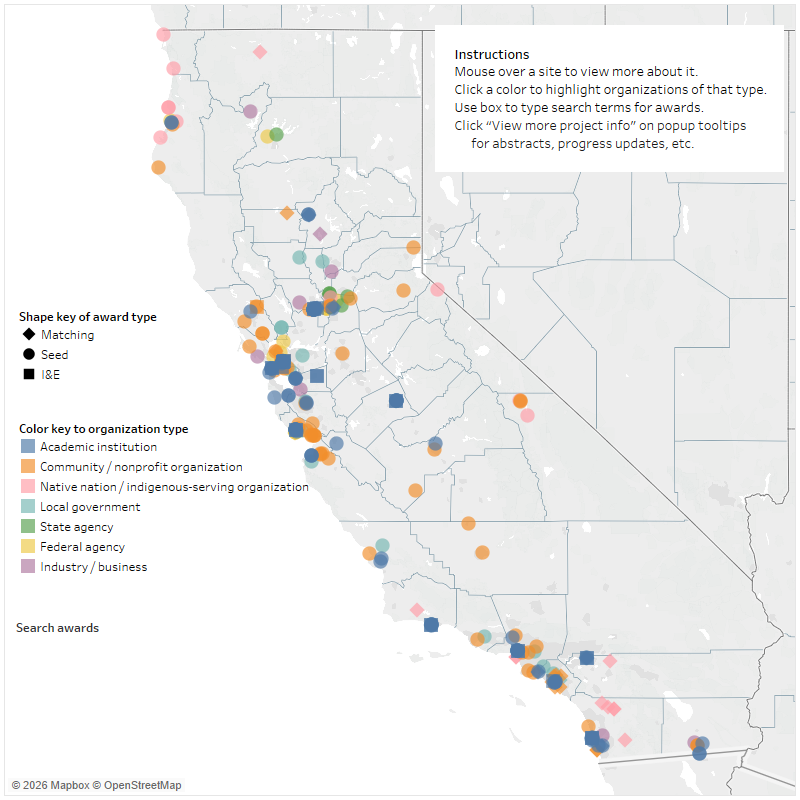
Discover the statewide impact of the California Climate Action Initiative by exploring this map of sites for the California Climate Action Seed and Matching Grants and the UC Climate Action Innovation & Entrepreneurship Awards.
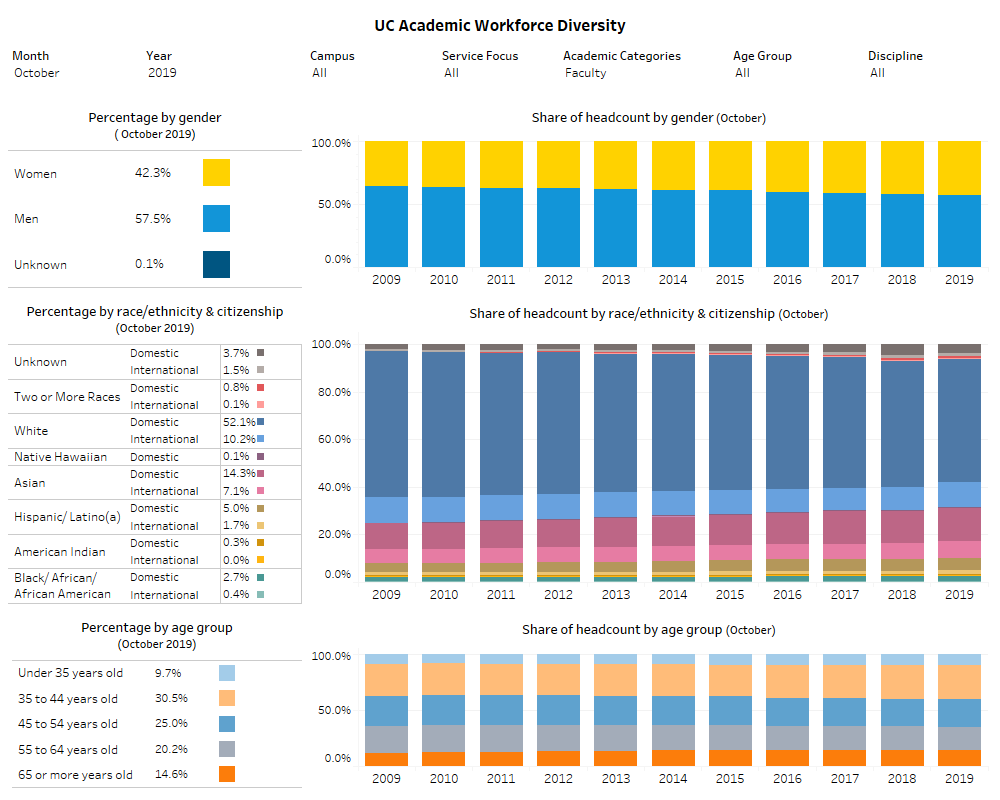
Current state and historical patterns in the gender, ethnic, and age diversity of UC employee segments using various interactive filters. (Back to 2011.)