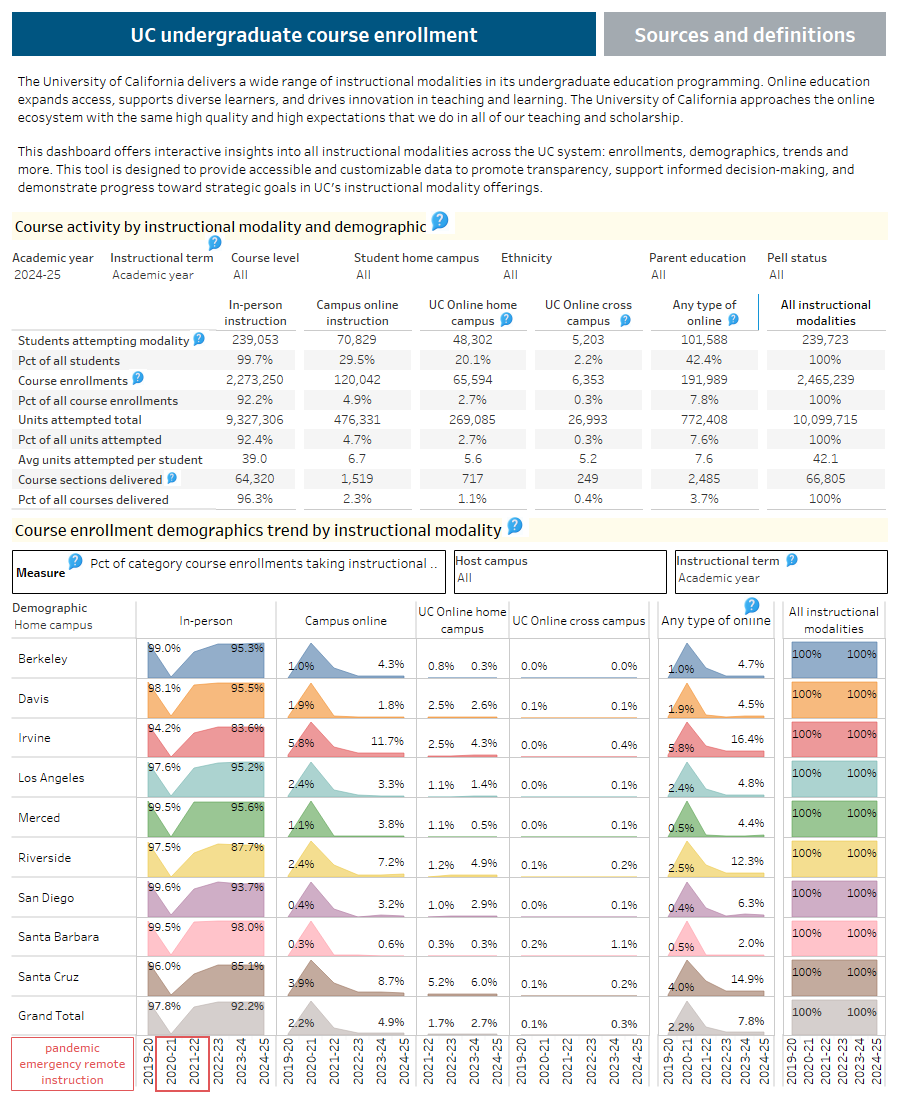
This dashboard provides insights into the different undergraduate instructional modalities across the UC system, including the number of students taking online vs in-person courses, the share of UC’s instructional offerings that are offered online vs. in-person, and the demographics of students by each instructional modality.
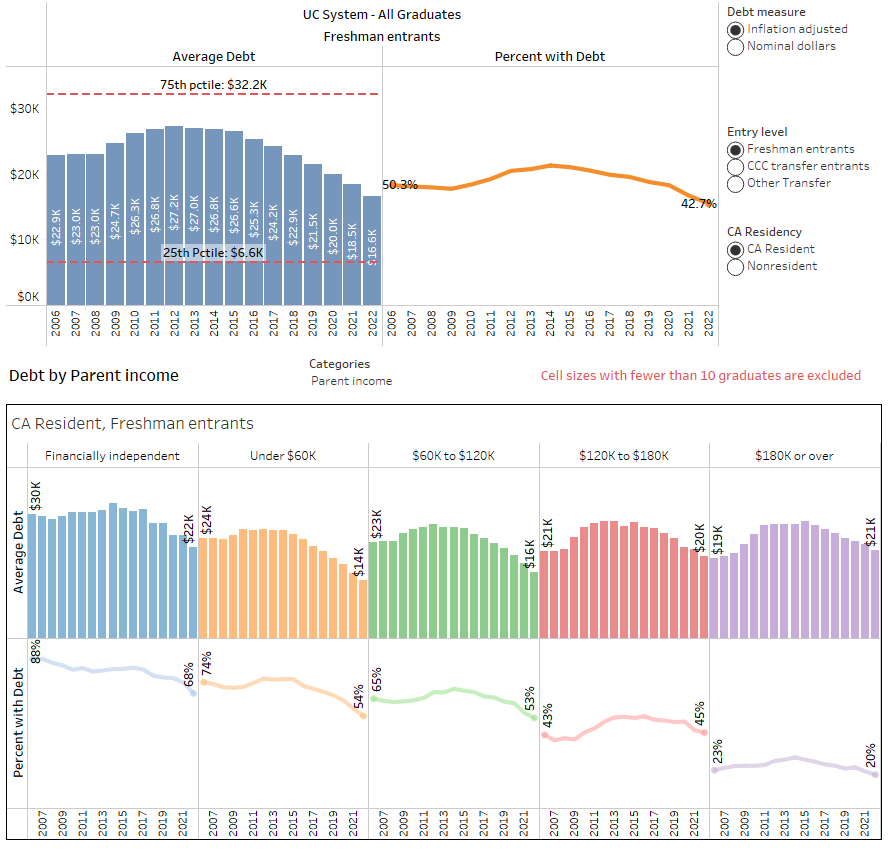
Gain knowledge of UC Undergraduate financial support, net cost of attendance, student loan debt, and cumulative debt burden at graduation for UC students.
The UC Community Safety Plan calls on all UC campuses to collect and publicly share uniform campus safety data to empower the UC community and inform change.
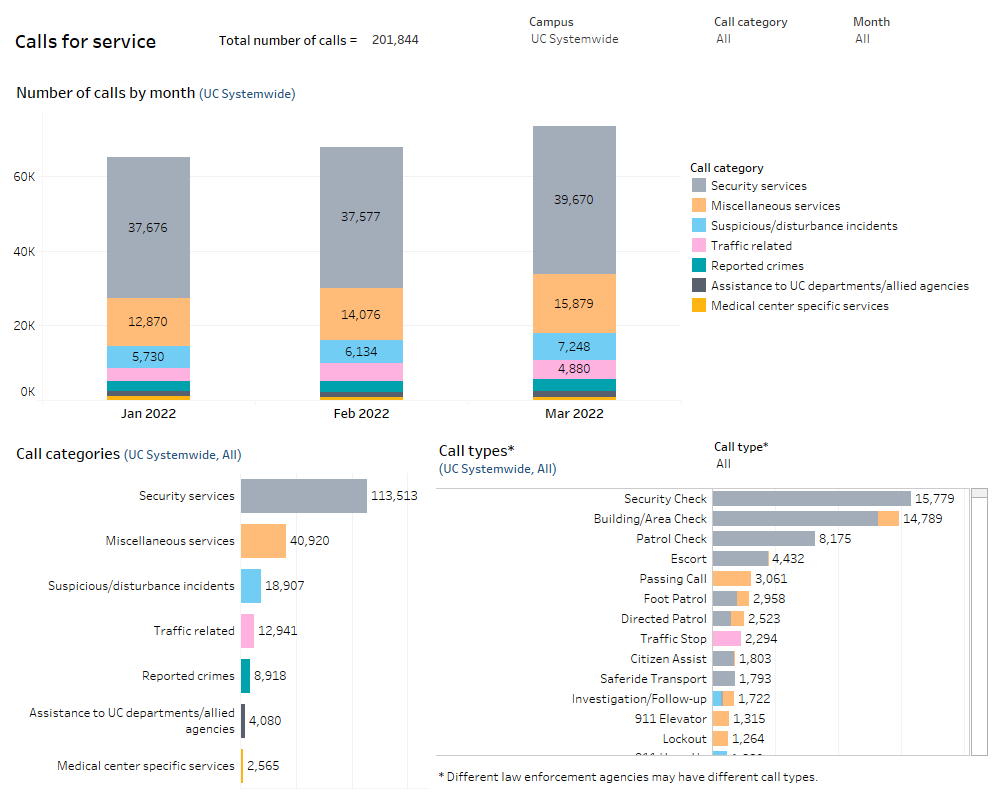
Calls for service to law enforcement agencies generally include calls to “911” for emergency assistance and may also include calls to non-emergency numbers. UC Police Departments are required to report monthly data to UCOP on civilian calls for service, noting call category (standardized across UC locations), call type (details that can be different by location), and month received.
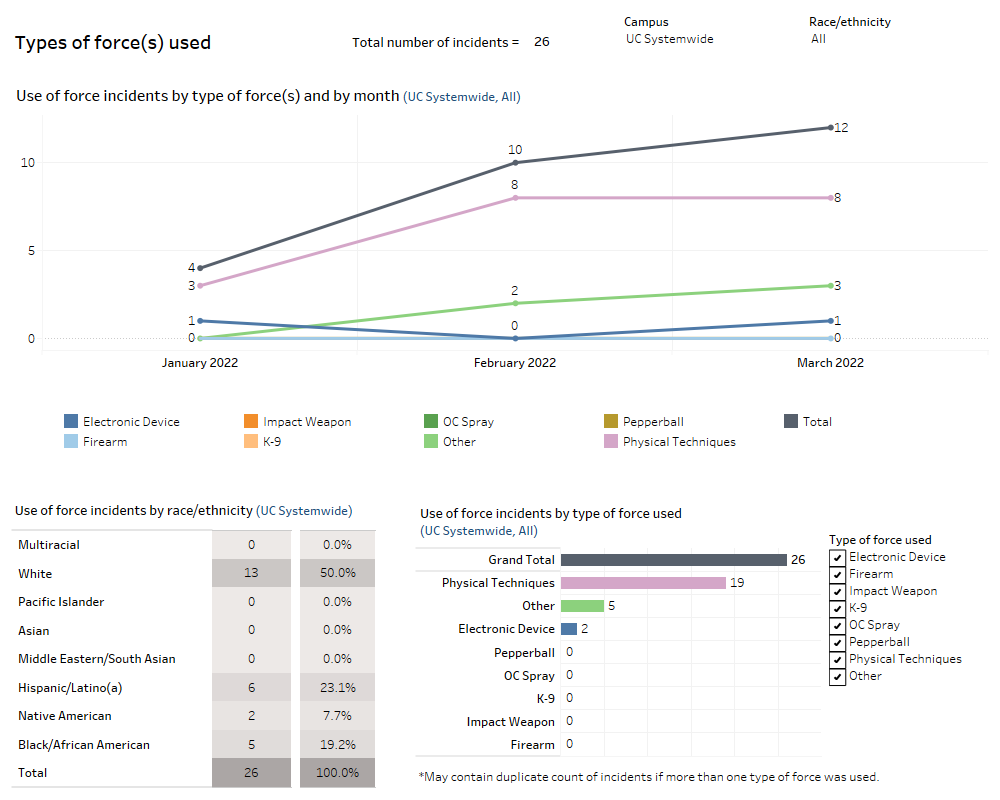
All UC locations are required to submit quarterly data on use of force incidents to the UC Office of the President. This reporting includes incidents that qualify for mandatory reporting to the California Department of Justice along with certain incidents that do not qualify for state reporting.
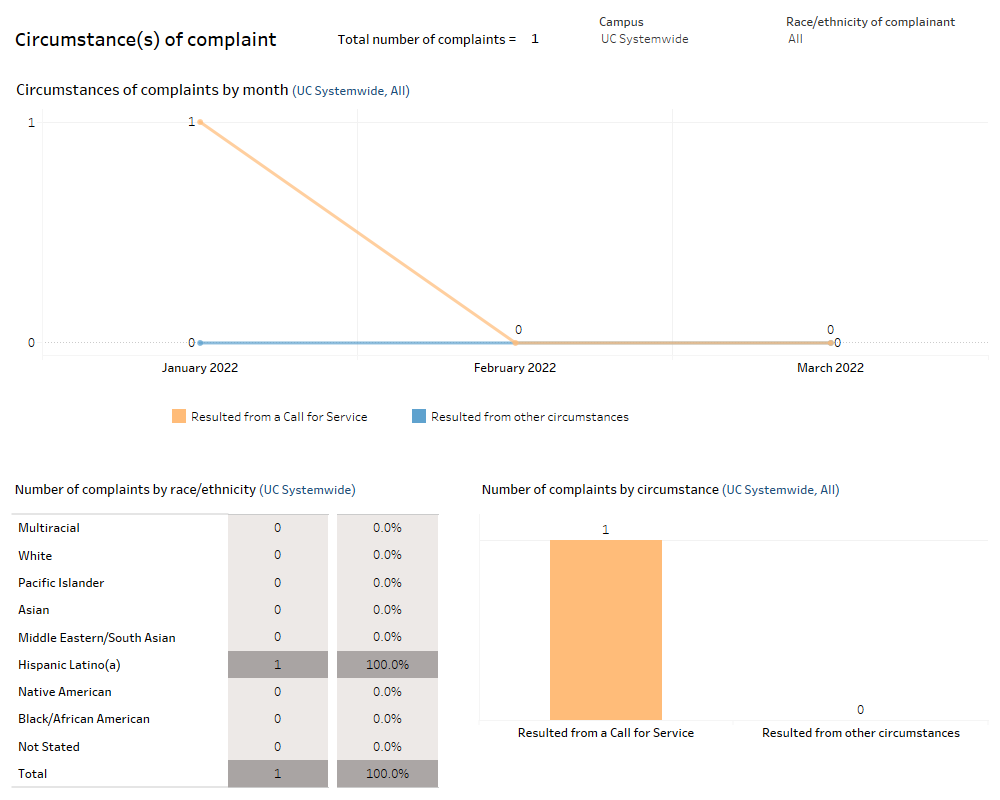
Consistent with California Penal Code 832.5, all UC Police Departments have procedures that allow civilians to lodge complaints against officers and to post information on their websites on how to submit a complaint or a commendation. UC Police Departments are required to report data to UCOP on resolved complaints, including information about the civilian, the interaction, allegation, and the results of these complaints.
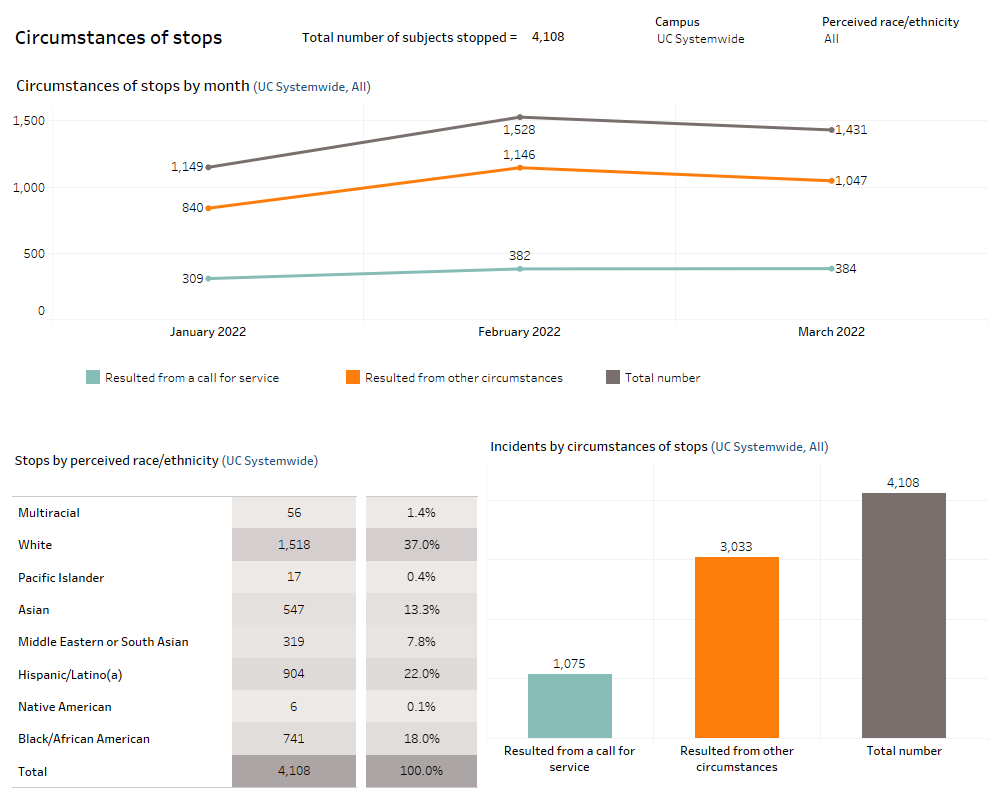
California’s Racial and Identity Profiling Act (RIPA) requires that California law enforcement agencies collect information from officers about the "perceived race or ethnicity" of the people they detain. The data in this dashboard are aligned with UC Police Departments report to the California Department of Justice in compliance with RIPA.
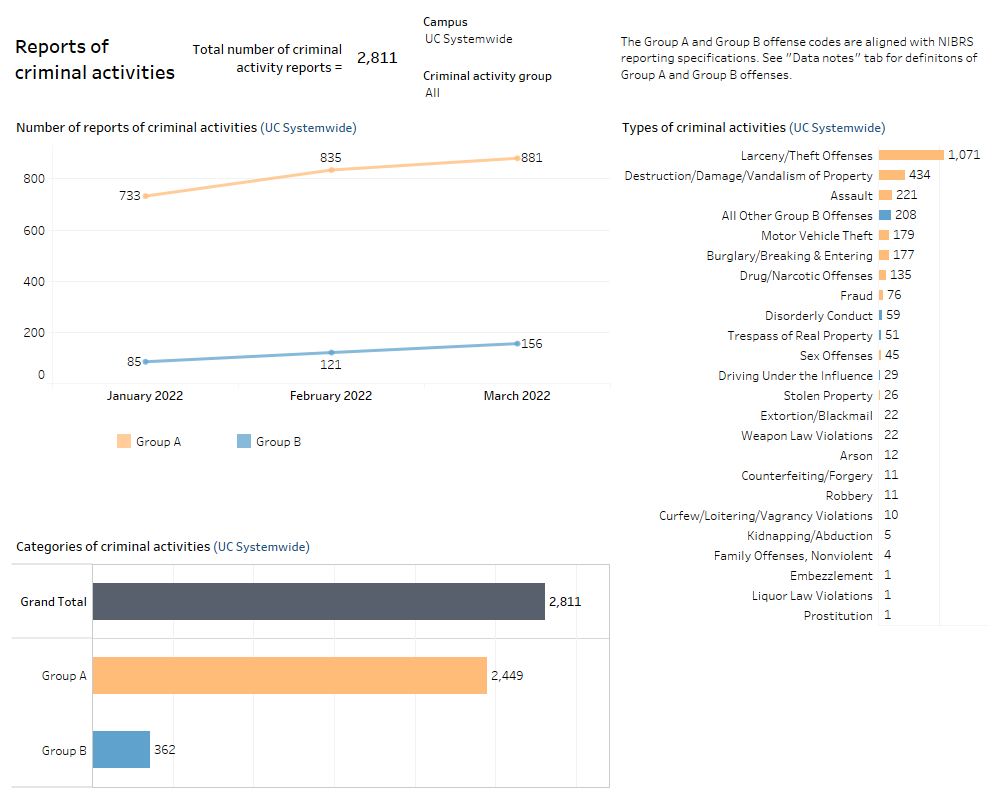
UC Police Departments report monthly crimes data from their jurisdictions to the U.S. Department of Justice. UC Police Departments also contribute information to help UC comply with community crime and safety reporting requirements of the Clery Act. The data reported in this dashboard do not serve as the UC campus’ official Clery reporting, but provide aggregated information regarding crimes reported and investigated at the UC campuses and medical centers.