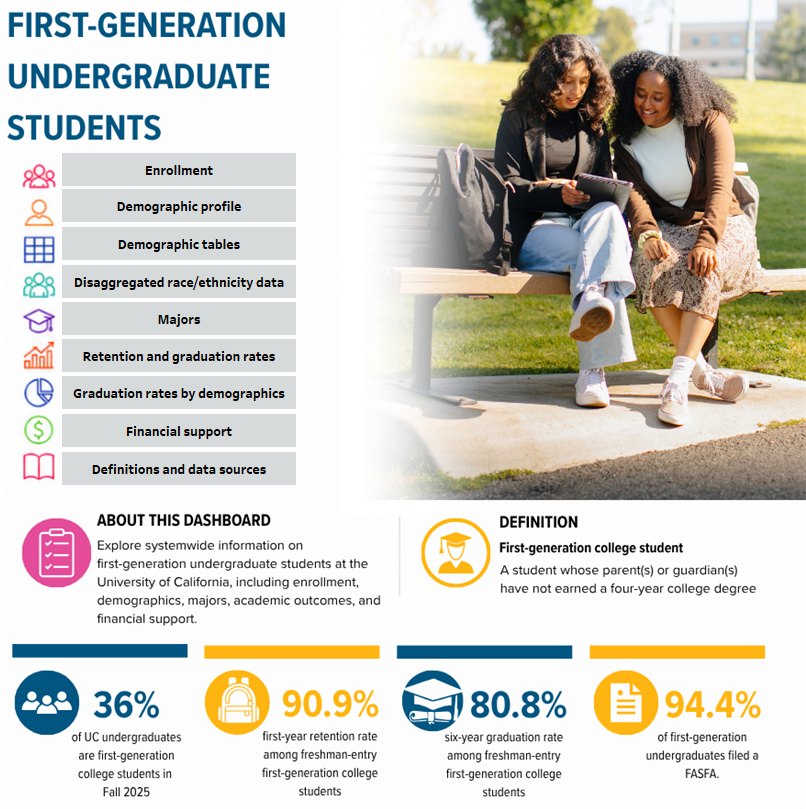
Systemwide data on first-generation undergraduates including enrollment, demographics, disaggregated race/ethnicity enrollment data, majors, first-year retention and graduation rates, and financial support information.
First-generation college student is defined as a student where neither parent nor guardian have earned a four-year degree.
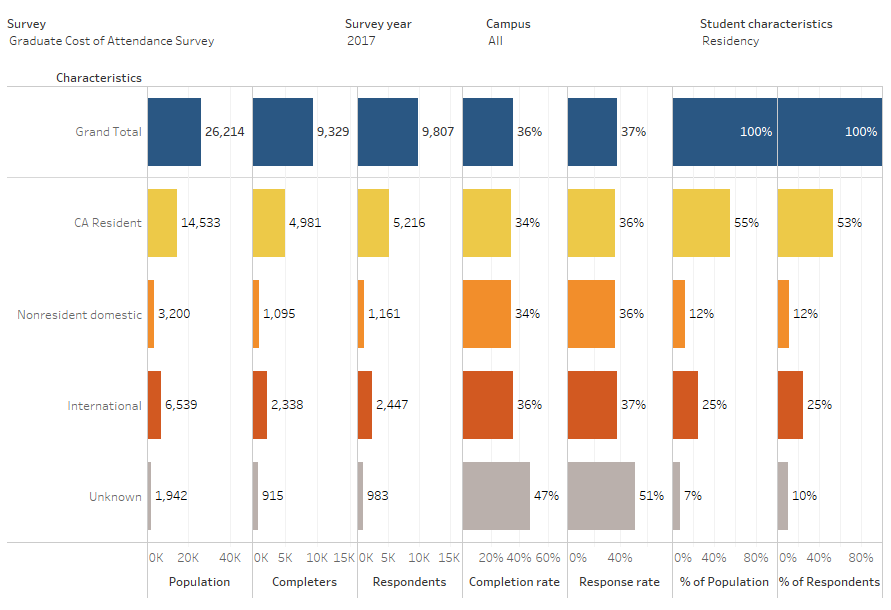
UC systemwide student survey response and completion rates are presented in this dashboard. The data may be filtered by campus and year, as well several characteristics such as ethnicity, gender, First generation status, Pell status and others related to discipline and student level.
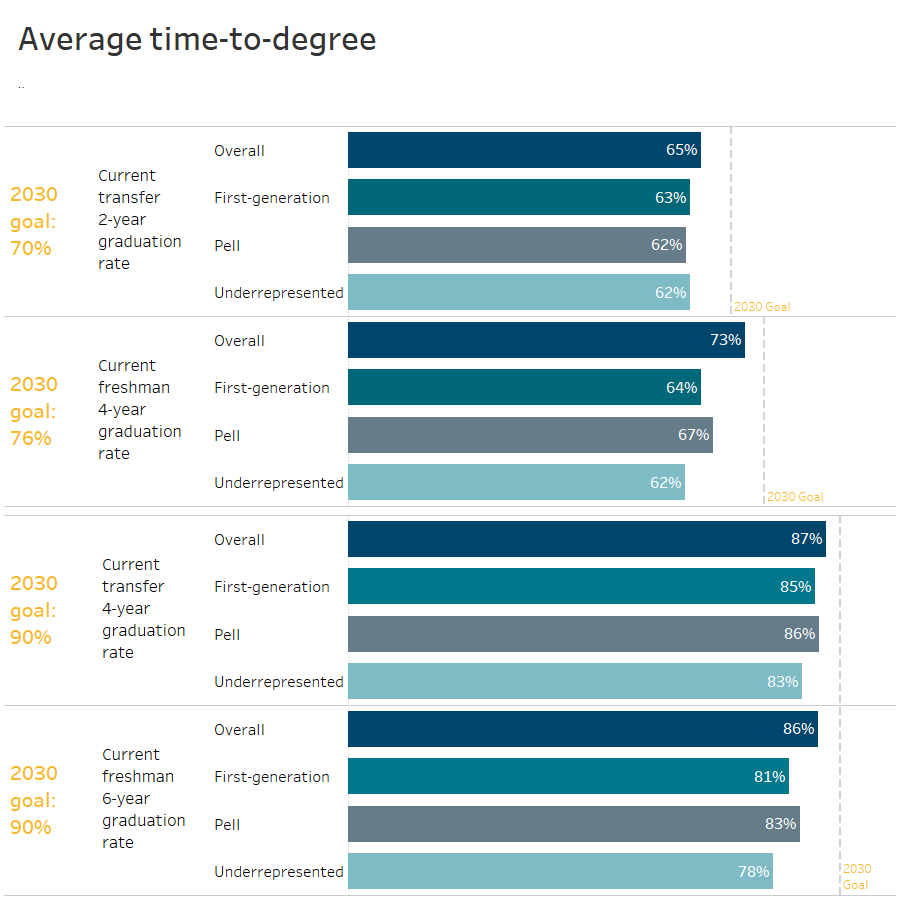
This dashboard shows graduation outcomes for recent cohorts of UC undergraduate students who engaged with campus Disability Services Offices (DSOs). Data are available by entry pathway, campus, and cohort year.
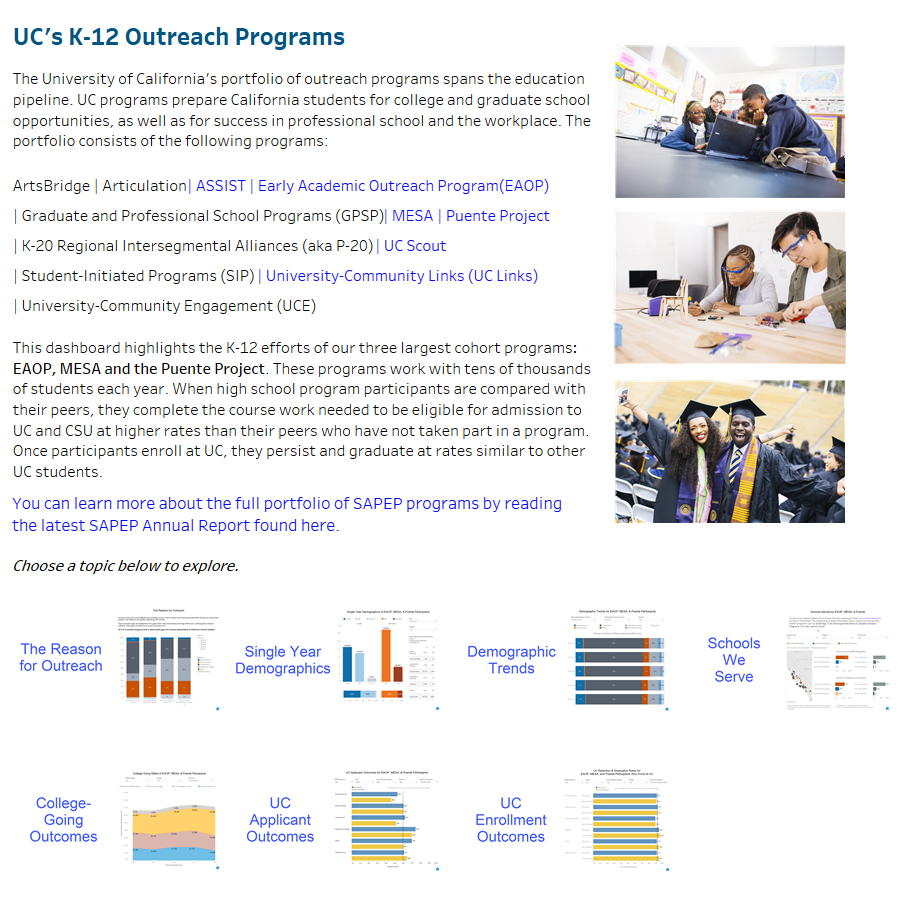
UC’s K-12 outreach programs prepare California students for college and graduate school opportunities, as well as for success in professional school and the workplace.